

EDITORS' PICK
PROJECTS
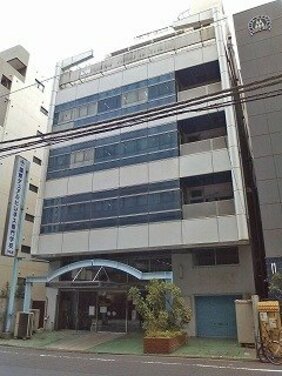
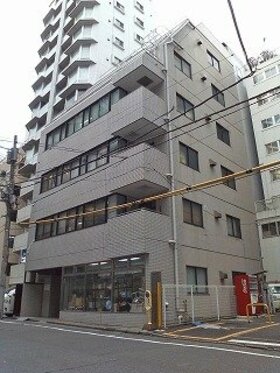
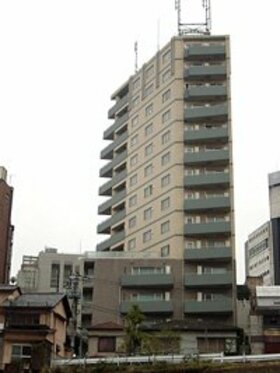
Taisei-Yuraku developing apartment building in Otsuka
Chuo-ku's Taisei-Yuraku Real Estate will construct a rental apartment building with a retail space in Minami-Otsuka, Toshima-ku. Construction will start in June 2024, with completion targeted for March 2027.
DEALS
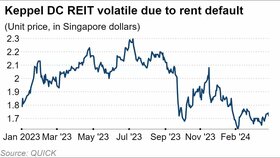
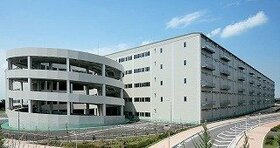
GLP J-REIT to acquire replacement asset for fire damage

DEALS
LOCAL
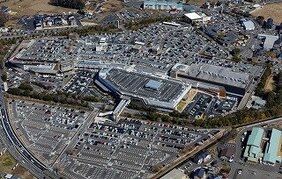
Loadstar acquiring six resort hotels

BUSINESS
Japan land prices rise most in 33 years, but foreign investors shy away
DEALS
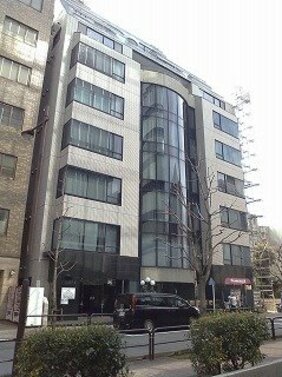
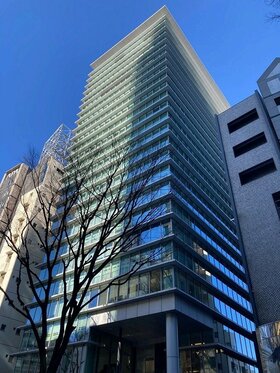
JR East subsidiary acquires Shibuya building from German fund
DEALS
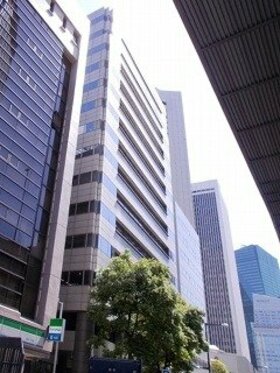
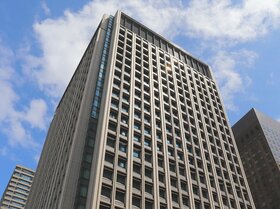
Nippon Life Insurance acquires part of Otemon Tower
DEALS
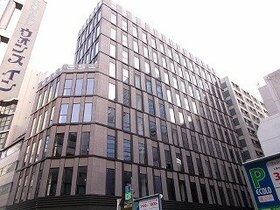
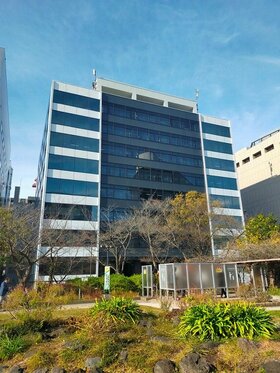
Shochiku acquires two Ginza office buildings from Angelo Gordon

TRENDS
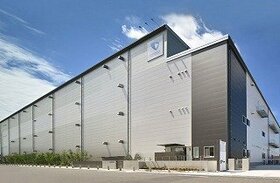
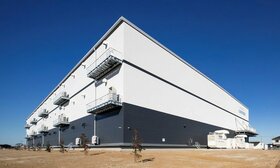
Mitsui enters U.S. logistics business, investing up to Y68bn

BUSINESS
Sumitomo Mitsui leasing firm to buy Singapore private funds for $270m
DEALS